

| Attachment | Size |
|---|---|
| 63.92 KB |
Hi
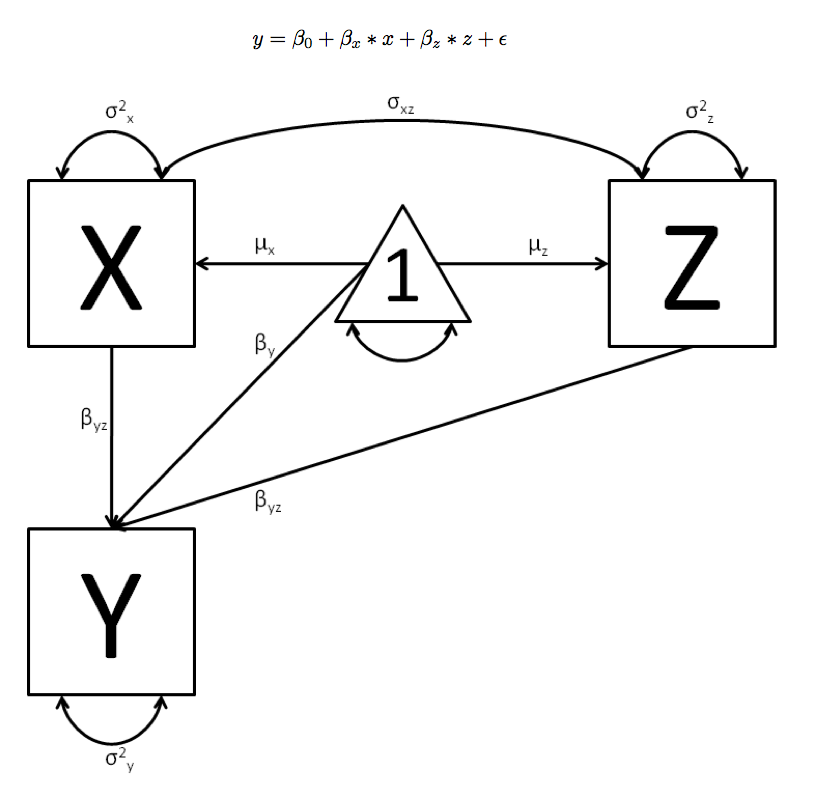
There are two paths called βyz in the un-titled figure currently on page 26
Seems that one should be βx and the other βz (the one that is currently βy should be β0)?
Similar issue in the simple regression figure (unlabeled, but currently on page 22)
Somewhere around here in the documentation some explanation of the triangle should be given too: I think users will be wondering:
If it's a mean, how can it be connected to all three variables?
What does the "1" in the middle mean? Is that a mean? or a variance?
Why isn't the variance of the triangle labeled? What label would it have if it was?
Does it also have a label, or is "1" its label?
Do fixed variables have their value as the label?
What about two variables fixed to the same value: does that create labels that link them if one is subsequently freed or edited?