

| Attachment | Size |
|---|---|
| 26.42 KB |
Dear Mike,
A colleague and I studied the factor structure of a scale using the metaSEM package. The reviewers asked us for residual covariance matrice of structural model we construct. I couldn't see a command for this in the metaSEM package. There is vcov but this command gives sampling covariance matrices. Is there a way to see residual covariance matrices?
Sincerely
The script that we used to construct our model is ad follow:
library(metaSEM)
library(lavaan)
sdeğ <- 6
değad <- c("m1","m2","m3","m4","m5","m6")
etiket <- list(değad,değad)
korver <- list()
for (i in 1:nrow(veri)){
korver[[i]] <- vec2symMat(as.matrix(veri[i,3:17]),diag = FALSE)
dimnames(korver[[i]]) <- etiket
}
korver
REM1 <- tssem1(Cov=korver, n=veri$N, method="REM", RE.type="Diag")
summary(REM1)
model<-"
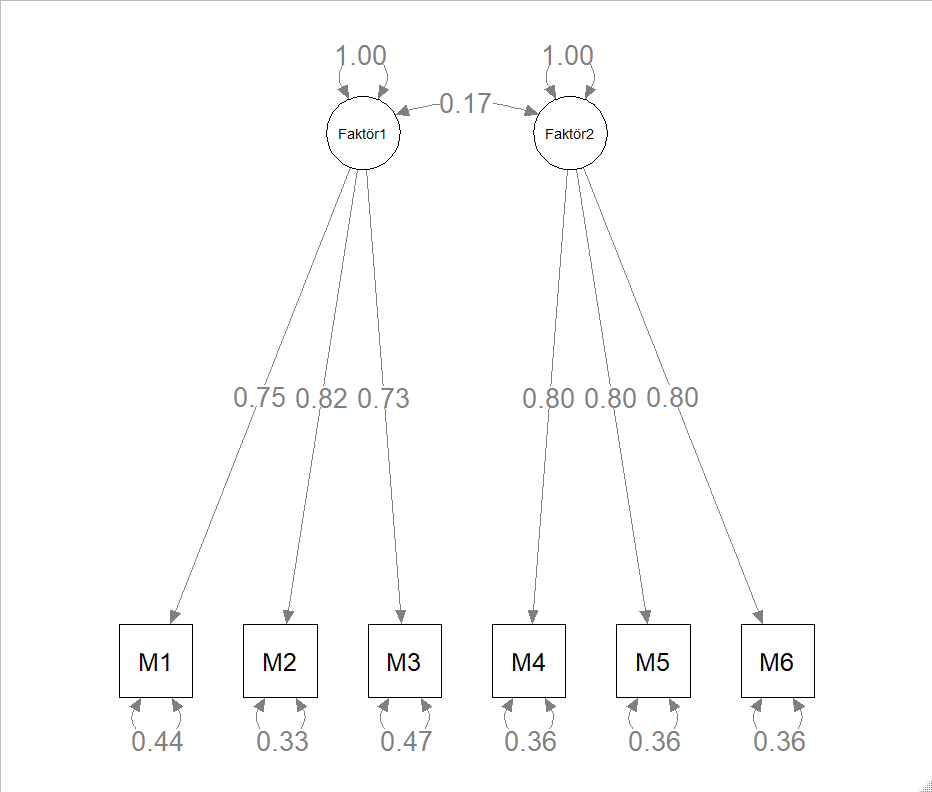
Faktor1=~M1+M2+M3
Faktor2=~M4+M5+M6
Faktor1~~Faktor2"
RAM <- lavaan2RAM(model, obs.variables=c("M1","M2","M3","M4","M5", "M6"),
A.notation="on", S.notation="with")
REM2 <- tssem2(REM1, RAM=RAM, intervals="LB")
summary(REM2)
Call:
wls(Cov = pooledS, aCov = aCov, n = tssem1.obj$total.n, RAM = RAM,
Amatrix = Amatrix, Smatrix = Smatrix, Fmatrix = Fmatrix,
diag.constraints = diag.constraints, cor.analysis = cor.analysis,
intervals.type = intervals.type, mx.algebras = mx.algebras,
model.name = model.name, suppressWarnings = suppressWarnings,
silent = silent, run = run)
95% confidence intervals: Likelihood-based statistic
Coefficients:
Estimate Std.Error lbound ubound z value Pr(>|z|)
M1onFaktor1 0.75023 NA 0.69404 0.80902 NA NA
M2onFaktor1 0.81600 NA 0.75594 0.87878 NA NA
M3onFaktor1 0.72925 NA 0.67467 0.78664 NA NA
M4onFaktor2 0.79731 NA 0.72519 0.87357 NA NA
M5onFaktor2 0.80009 NA 0.72521 0.87772 NA NA
M6onFaktor2 0.79901 NA 0.72891 0.87430 NA NA
Faktor1withFaktor2 0.17314 NA 0.13774 0.20912 NA NA
Goodness-of-fit indices:
Value
Sample size 5769.0000
Chi-square of target model 11.0801
DF of target model 8.0000
p value of target model 0.1972
Number of constraints imposed on "Smatrix" 0.0000
DF manually adjusted 0.0000
Chi-square of independence model 2034.0182
DF of independence model 15.0000
RMSEA 0.0082
RMSEA lower 95% CI 0.0000
RMSEA upper 95% CI 0.0186
SRMR 0.0193
TLI 0.9971
CFI 0.9985
AIC -4.9199
BIC -58.2020
OpenMx status1: 0 ("0" or "1": The optimization is considered fine.
Other values indicate problems.)
plot(REM2)