OpenMx
Published on OpenMx (https://openmx.ssri.psu.edu)

Home > Help Plotting Observed and Estimated Model Means in OpenMx - Growth Models

3 posts / 0 new
Log in [1] or register [2] to post comments
Last post [3]
Mon, 04/08/2019 - 08:08
#1 [4]
Aivil's picture
Aivil [5]
Offline
Joined: 03/14/2019 - 09:44
Help Plotting Observed and Estimated Model Means in OpenMx - Growth Models
AttachmentSize
Image icon picture berlin, parra & williams paper.png [6]67.44 KB

Hello,

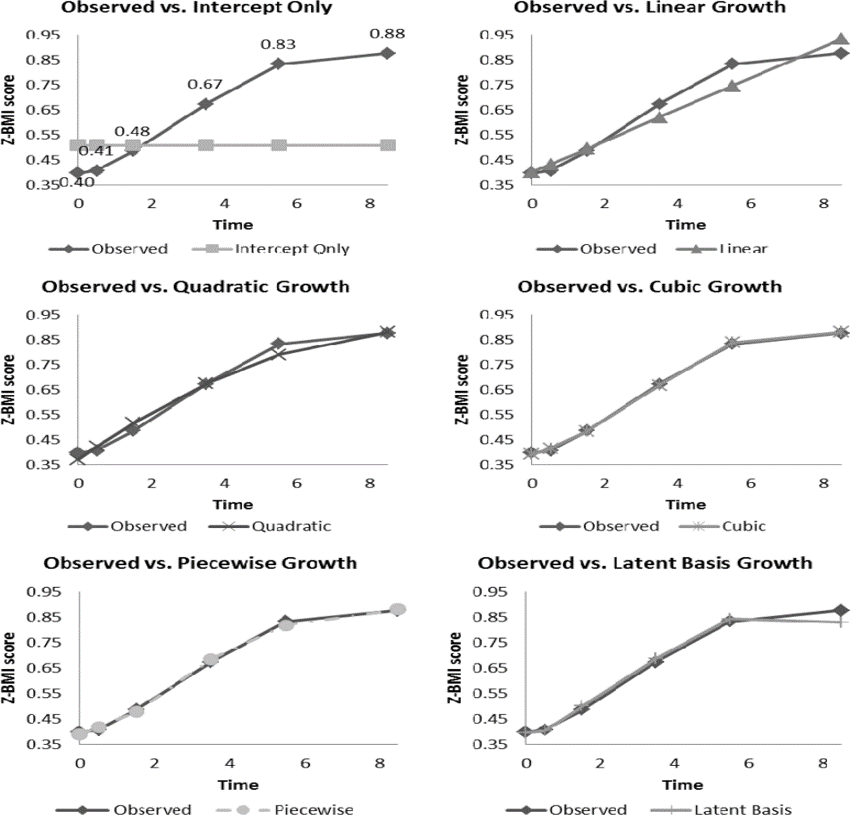
I have been fitting different growth models to my data, and I would like to plot the observed and estimated model means in OpenMx.

I would like to obtain similar graphs to the ones attached, which are produced in Mplus. The paper they belong to is: (https://academic.oup.com/jpepsy/article/39/2/188/885587#supplementary-data)

Do you have any advice for that?

Many thanks.

Top

Copyright © 2007-2021 The OpenMx Project

Powered by Drupal

Source URL: https://openmx.ssri.psu.edu/node/4474

Links
[1] https://openmx.ssri.psu.edu/user/login?destination=node/4474%23comment-form
[2] https://openmx.ssri.psu.edu/user/register?destination=node/4474%23comment-form
[3] https://openmx.ssri.psu.edu/node/4474#comment-8117
[4] https://openmx.ssri.psu.edu/node/4474
[5] https://openmx.ssri.psu.edu/user/42474
[6] https://openmx.ssri.psu.edu/sites/default/files/picture%20berlin%2C%20parra%20%26%20williams%20paper.png