
Calculate sample size for an indirect effect using simsem
 blazej
Joined: 11/20/2018
blazej
Joined: 11/20/2018
Please note - I posted this on simsem github but I feel here is more adequate
(https://github.com/simsem/simsem/issues/55)
Hello,
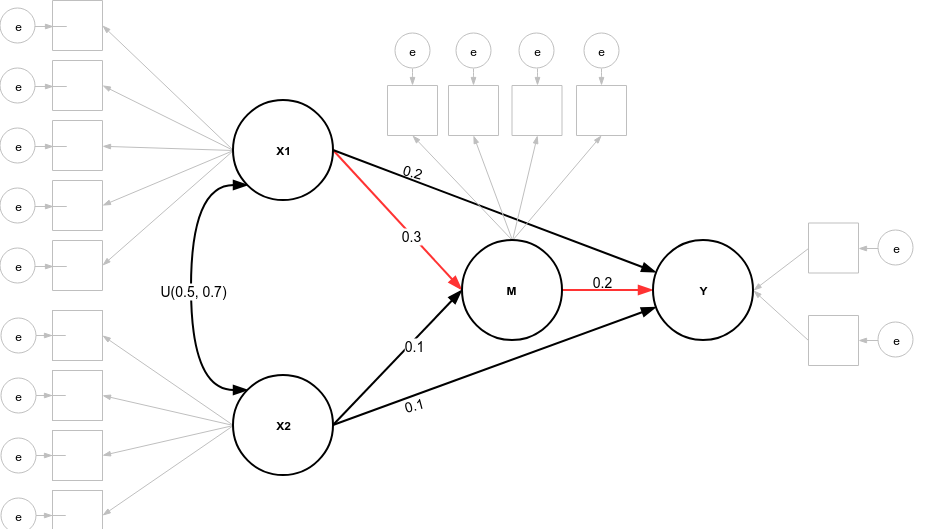
I'm somehow new to the subject of running simulations and would very much appreciate some help in sorting out how to set up code for estimating sample size to observe an indirect effect in a setup like this:
https://user-images.githubusercontent.com/22635132/51598061-058a0000-1e…
Values represent typical effect sizes observed in previous research.
All scales (X1, X2, M, Y) have a reliability index Cronbachs alpha 0.85 to 0.95 depending on study.
Exemplary lavaan syntax (I'm still not that used to openMx code) to fit this model would be this:
```
sem = '
X1 =~ xv1 + xv2 + xv3 + xv4 + xv5
X2 =~ xxv1 + xxv2 + xxv3 + xxv4
M =~ m1 + m2 + m3 + m4
Y =~ y1 + y2
X1~~X2
# direct
# direct effect1
Y ~ c1 * X1
Y ~ c2 * X2
# mediator
M ~ a1 * X1
M ~ a2 * X2
Y ~ b * M
Direct_X1 := c1
Indirect_X1 := a1 * b
Total_X1 := c1 + (a1 * b)
Direct_X2 := c2
Indirect_X2 := a2 * b
Total_X2 := c2 + (a2 * b)
'
```
What I'm interested in is a sample size do detect an indirect effect of X1 with 80% power (in similar studies with composite measures the IE has a beta of 0.25; 95%CI (0.19; 0.31).
Could anyone please help me out? I'm really stuck here
I'd preferably use the simsem matrix approach as it seems to me I can learn from it the most
not simsem but
Here's a stab at it,
library(OpenMx)
latents <- c(paste0('X',1:2), 'M', 'Y')
manifests <- c(paste0('xv', 1:5), paste0('xxv', 1:4),
paste0('m',1:4), paste0('y',1:2))
b1 <- mxModel(
"blazej", type="RAM",
latentVars = latents,
manifestVars = manifests,
# fix latent variances at 1
mxPath(latents, arrows=2, value=1, free=FALSE),
# add some manifest measurement error
mxPath(manifests, arrows=2, values=.2, labels = "e"),
# manifests are mean centered
mxPath('one', manifests, free=FALSE),
# loadings from latents to manifests
mxPath('X1', paste0('xv', 1:5), values = 1),
mxPath('X2', paste0('xxv', 1:4), values = 1),
mxPath('M', paste0('m',1:4), values = 1),
mxPath('Y', paste0('y',1:2), values = 1),
# covariance between X
mxPath('X1','X2',values=runif(1, .5, .7)),
# direct paths
mxPath('X1','Y',values=.2),
mxPath('X2','Y',values=.1),
# indirect paths
mxPath('X1', 'M', values=.3, labels="x1_to_m"),
mxPath('X2', 'M', values=.5),
mxPath('M', 'Y', values=.2, labels="m_to_y"),
# effect algebra
mxAlgebra(x1_to_m * m_to_y, name = "Indirect_X1"))
# Does the algebra produce the expected result?
mxEval(Indirect_X1, b1, compute = TRUE)
b1False <- omxSetParameters(b1, c('x1_to_m','m_to_y'),
values=0, free = FALSE)
mxPowerSearch(b1, b1False)
For this particular comparison, you need about 120 participants for 80% power.
Log in or register to post comments
In reply to not simsem but by jpritikin
Oh my! Thank you.
Oh my! Thank you.
I will study this closely so I can modify it as well for future research :)
Is there a straightforward way to simulate for rmsea (or other fit indices) of entire model?
Log in or register to post comments
In reply to Oh my! Thank you. by blazej
RMSEA
> Is there a straightforward way to simulate for rmsea (or other fit indices) of entire model?
Using the statistics argument to mxPower, you can use AIC or BIC instead of LRT. As for RMSEA, this isn't implemented yet. I created an [issue in our bug tracker](https://github.com/OpenMx/OpenMx/issues/130)
Log in or register to post comments
Great, thank you very much!
Great, thank you very much!
One last thing that I wonder:
In my simulation model I assume some parameters will be random
`mxPath('X1','X2',values=runif(1, .5, .7))`
In fact I'd like to add some more randomness as well at manifest level:
` # add some manifest measurement error
mxPath(manifests, arrows=2, values = rnorm(1, 1, 0.6)),`
For some reason
` # add some manifest measurement error
mxPath(manifests, arrows=2, values = rnorm(15, 1, 0.6), labels = paste0("e", c(1:15))),` won't work.
But actually what I'm thinkig is this:
no of probes in mxPowerSearch controls number of samples for confidence intervals.
Would it make any sense to put both mxModel() and mxPowerSearch() in a for loop to get a list of power estimates for varying estimates?
I'd like to use 1000 random setups with 1000 CI resamples in each.
Log in or register to post comments
In reply to Great, thank you very much! by blazej
plan
Yes, that sounds like a fine plan. However, I'm not sure you need to use so many probes in mxPowerSearch. As few as 150 might be enough because there is going to be a lot of uncertainty in the N anyway because of the randomness in your parameters.
Log in or register to post comments
In reply to plan by jpritikin
Makes sense - thanks :)
Makes sense - thanks :)
Is there a way to extract from the mxModel() values of paramters that where set to random, so that I can store them for each `i in sims` ? For know I'm randomizing two paths:
`mxPath(manifests, arrows=2, values = rnorm(1, 0.5, 0.3)),
mxPath('X1','X2',values=runif(1, .6, .8)),`
So, I'd like to two additional columns for a dataframe saved by
`dat = mxPowerSearch(sim1, b1False, method = "empirical", probes=1000)
pwr = rbind(pwr, dat)}`
in the `for()` loop
I think I'm running out of questions ;)
Log in or register to post comments
In reply to Makes sense - thanks :) by blazej
introspecting the model
Yeah, the most flexible way is to introspect the model. Path coefficients are stored in the A matrix. So you can use
sim$A$valuesto get the whole matrix and then pick out the cell with square brackets likesim$A$values[r,c]Log in or register to post comments
In reply to plan by jpritikin
Unfortunately with 150 probes
Unfortunately with 150 probes I get errors pretty often that prevent the script from continuing the loop.
`
R 1 init N 100BŁĄD: The job for model 'bl' exited abnormally with the error message: fit is not finite (0: The continuous part of the model implied covariance (loc2) is not positive definite in data 'bl.data' row 64. Detail:
covariance = matrix(c( # 15x15
0.665358, 0.669118, 0.669118, 0.669118, 0.669118, 0.519629, 0.519629, 0.519629, 0.519629, 0.223277, 0.223277, 0.223277, 0.223277, 0.128257, 0.128257
, 0.669118, 0.665358, 0.669118, 0.669118, 0.669118, 0.519629, 0.519629, 0.519629, 0.519629, 0.223277, 0.223277, 0.223277, 0.223277, 0.128257, 0.128257
, 0.669118, 0.669118, 0.665358, 0.669118, 0.669118, 0.519629, 0.519629, 0.519629, 0.519629, 0.223277, 0.223277, 0.223277, 0.223277, 0.128257, 0.128257
, 0.669118, 0.669118, 0.669118, 0.665358, 0.669118, 0.519629, 0.519629, 0.519629, 0.519629, 0.223277, 0.223277, 0.223277, 0.223277, 0.128257, 0.128257
, 0.669118, 0.669118, 0.669118, 0.669118, 0.665358, 0.519629, 0.519629, 0.519629, 0.519629, 0.223277, 0.223277, 0.223277, 0.223277, 0.128257, 0.1282
Dodatkowo: Komunikat ostrzegawczy:
W poleceniu 'mvtnorm::rmvnorm(nrows, theMeans, theCov)':
sigma is numerically not positive semidefinite
`
Haven't found a way around this, other than setting 500 probes or manually starting the script again with results stored from each run.
Log in or register to post comments
In reply to Unfortunately with 150 probes by blazej
probes
Hm, too bad. I wonder if a reliable heuristic could be devised for the number of probes needed.
Log in or register to post comments